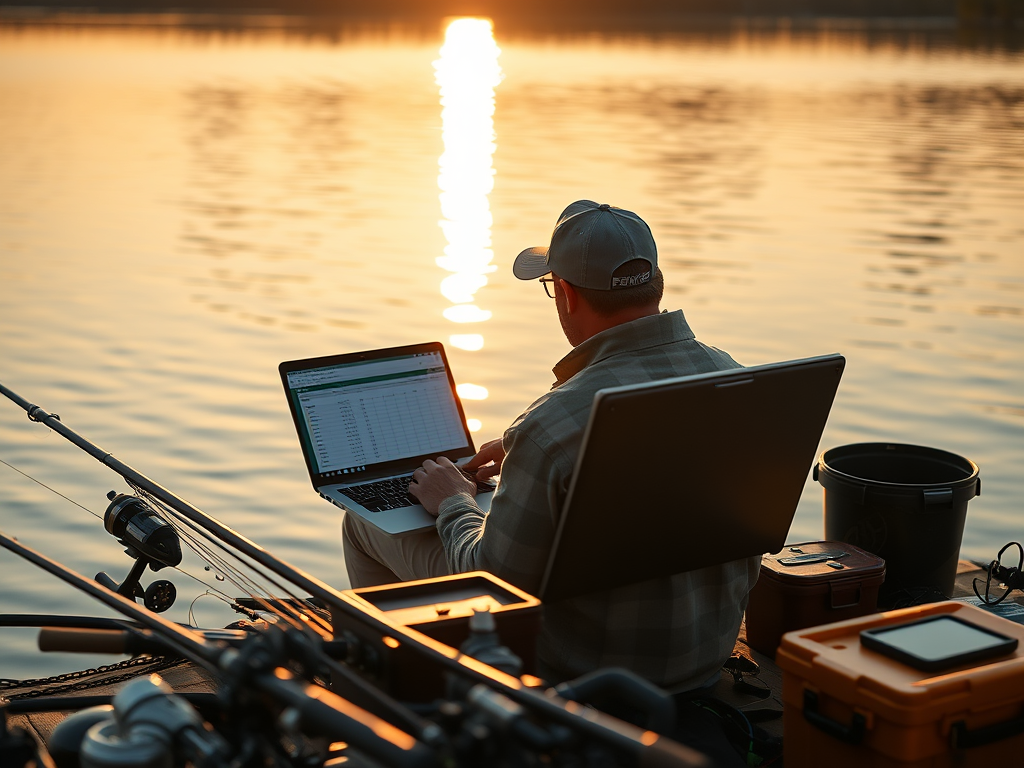
Fishing can feel mysterious. One weekend the bite is on fire and the next weekend it is dead quiet. Conditions change, fish move, and bait disappears without warning. Most people rely on gut feeling or guesswork to decide when and where to fish. But if you want consistent results you need a real system. That is where keeping track of data becomes one of the most powerful tools in your tackle box.
I have always loved fishing, science, and data. That’s the reason I created this website. I spend my weekdays analyzing water quality for work and my weekends chasing fish around Florida. For years I relied on experience and instinct, but once I started using technology to log my fishing trips, things began to change. Patterns became visible. Weather effects became measurable. And most importantly, my catch rates increased.
This post will walk you through why Excel is such a game changer, what to record, how to structure your data, and how to actually use it to catch more fish.
Why Track Fishing Data in the First Place

Every fishing trip creates a small mountain of information. Most anglers simply forget most of it or they just don’t realize how much data they are being exposed to. Fish behavior is not random. When you start tracking the details you will see patterns appear in the data that you never would have noticed on the water. Eventually, you may even be able to pin point the exact time of day that you need to fish to be most productive.
Some of the most valuable things you uncover include:
- Which tides actually work at your favorite spots
- What time of day gives you the most hookups
- Conditions that predict slow days
- Which lures outperform others
- Seasonal trends in species you target
- The real relationship between water clarity and bite quality
- How weather fronts impact fish behavior
- Your personal hotspots and dead zones
Fishing is chaotic. Tracking it adds clarity and can make complicated situations more clear. When the patterns are visible you can plan future trips around what works rather than guessing.
Why Excel is the Perfect Tool for Fishing Logs
There are fishing apps everywhere, but Excel still beats them for one simple reason. Excel gives you complete control. Also, it’s really easy to use.
Apps decide what fields you can use. Excel lets you record anything you want. Apps hide the formulas. Excel lets you build your own analytics. Apps limit how you visualize your data. Excel gives you charts, tables, pivot tables, filters, and full customization. Also, you don’t really need to download a ton of different apps to track information when you have Excel.
As someone who works with water data every day I already use Excel constantly. It only made sense to use the same tool for fishing. And the best part is that anyone can do it. You do not need to be a scientist or engineer. If you can enter a few values and use basic formulas, you can create a powerful fishing tracker.
What to Track in Your Excel Fishing Log
Here are the most important data fields to record for each fishing trip. You can add more depending on your goals, but this list covers the essentials.
Trip Details
- Date
- Time when you start fishing
- How long until you got a bite
- Location
- Type of fishing such as offshore, inshore, out of a boat, etc.
Environmental Conditions
- Weather conditions
- Wind direction
- Wind speed
- Water temperature
- Air temperature
- Water clarity
- Tide stage
- Moon phase
- Recent rainfall
Fishing Variables
• Rod or setup used
• Line strength
• Lure or bait used
• Depth fished
• Retrieve speed
• Number of casts or general activity estimate
Results
• Total fish caught
• Species
• Size estimates
• Missed strikes
• Lure that performed best
• Notes on bait activity or structure
You do not need to record all of these every time. The key is consistency. The more you track the more insights appear. But even five to ten consistent variables can reveal real patterns.
Building the Excel Sheet to Track Fishing
The best way to structure your tracker is in a long table where each row represents one session or one segment of a session. For example if you start with jigging at sunrise then switch to live bait later in the morning, track those as two rows. This lets you compare your techniques in different conditions.
Here is a clean way to set it up:
Column A: Date
Column B: Start time
Column C: End time
Column D: Location
Column E: Tide
Column F: Water clarity
Column G: Wind direction
Column H: Wind speed
Column I: Lure
Column J: Species caught
Column K: Total caught
Column L: Notes
It will look like this:

From here you can add more columns as your skills grow. Excel is flexible. You can always expand.
Using Formulas to Make Your Data More Powerful
Excel becomes valuable when you let the math do the work. Here are a few formulas that make your tracker smarter.
Calculate total hours fished
=IF((C2>B2),C2-B2,(C2+1)-B2)
Track which lure performs best
You can filter the different lures that you have in your spreadsheet and see which lures produced the most fish as well as other conditions that may lead to higher catch rates. From this information, you can see trends in what works under various wind, weather, tides, water clarity, etc.
Calculate your catch rate
=K2/(C2-B2)
Find your best spot
Use Location as a row in a pivot table and catch rate as the value.
Once you build these small analytics tools your fishing data turns into something truly useful. The more sessions you log the more accurate the patterns become.
How the Patterns Help You Catch More Fish
When you look at enough logged data you start to see the truth behind your own fishing experiences.
You may learn that:
• Your favorite spot only works on incoming tide.
• Wind from the east produces higher catch rates.
• Murky water kills the bite.
• Water temperature matters much more than the moon.
• One specific lure dominates on cloudy days.
These are not generic internet fishing tips. This is your own real world data showing what helps you personally catch more fish.
Better decisions lead to better days on the water. Instead of showing up at random times you begin planning trips based on the exact conditions that have historically produced the most fish.
Example Insights You Might Discover
Here are things many anglers find once they start using data.
Time of day patterns
You may notice that nearly all your catches come within a two hour window. Fish often feed in bursts. Once you know your window you can focus your trips around it.
You can use the data and even make plots showing you the time of day where you caught the most fish. An example would look like this.

Lure efficiency
Sometimes the lure you think is best is not actually the one catching fish. Data strips away bias.
Seasonal changes
In Florida, for example, many species shift behavior dramatically during the hot summer months. When you track it, the seasonality becomes obvious.
Weather effects
Pressure changes, wind direction, and rainfall can all influence fish movement. Data shows which variables matter most where you fish.
Taking Your Tracker to the Next Level
Once you have a couple months of data you can start doing more advanced analysis.
Here are some upgrades:
- Add conditional formatting to highlight good days
- Build charts for catch rate vs tide
- Build charts for lure performance over time
- Add a drop down for lure types and fishing methods
- Build a species specific sheet to analyze behavior
- Overlay catch data with NOAA tide predictions
- Use mobile Excel on your phone to log in real time
If you want I can build a full automated Excel template for you with these features already set up.
Why Data Driven Fishing Works So Well
Fish behave according to environmental cues. They respond to light, current, oxygen levels, bait movement, water temperature, and predator pressure. When those variables align the bite turns on. When they do not, you get skunked. Unfortunately, you can’t analyze all of these parameters, but you can determine how these parameters might be affected by other parameters (wind, temperature, clarity), which can give helpful insight.
Using Excel to track your trips helps you identify which variables matter most for your local waters. Every fish you catch or do not catch becomes a data point that sharpens your understanding.
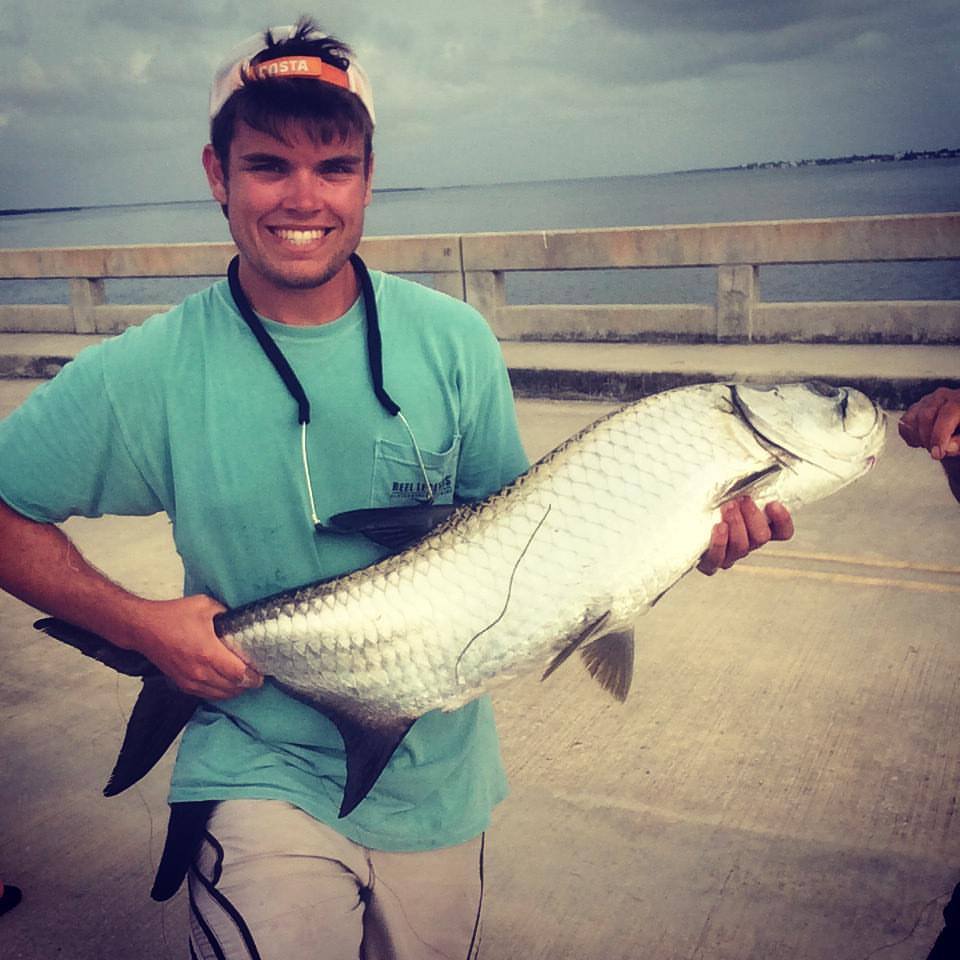
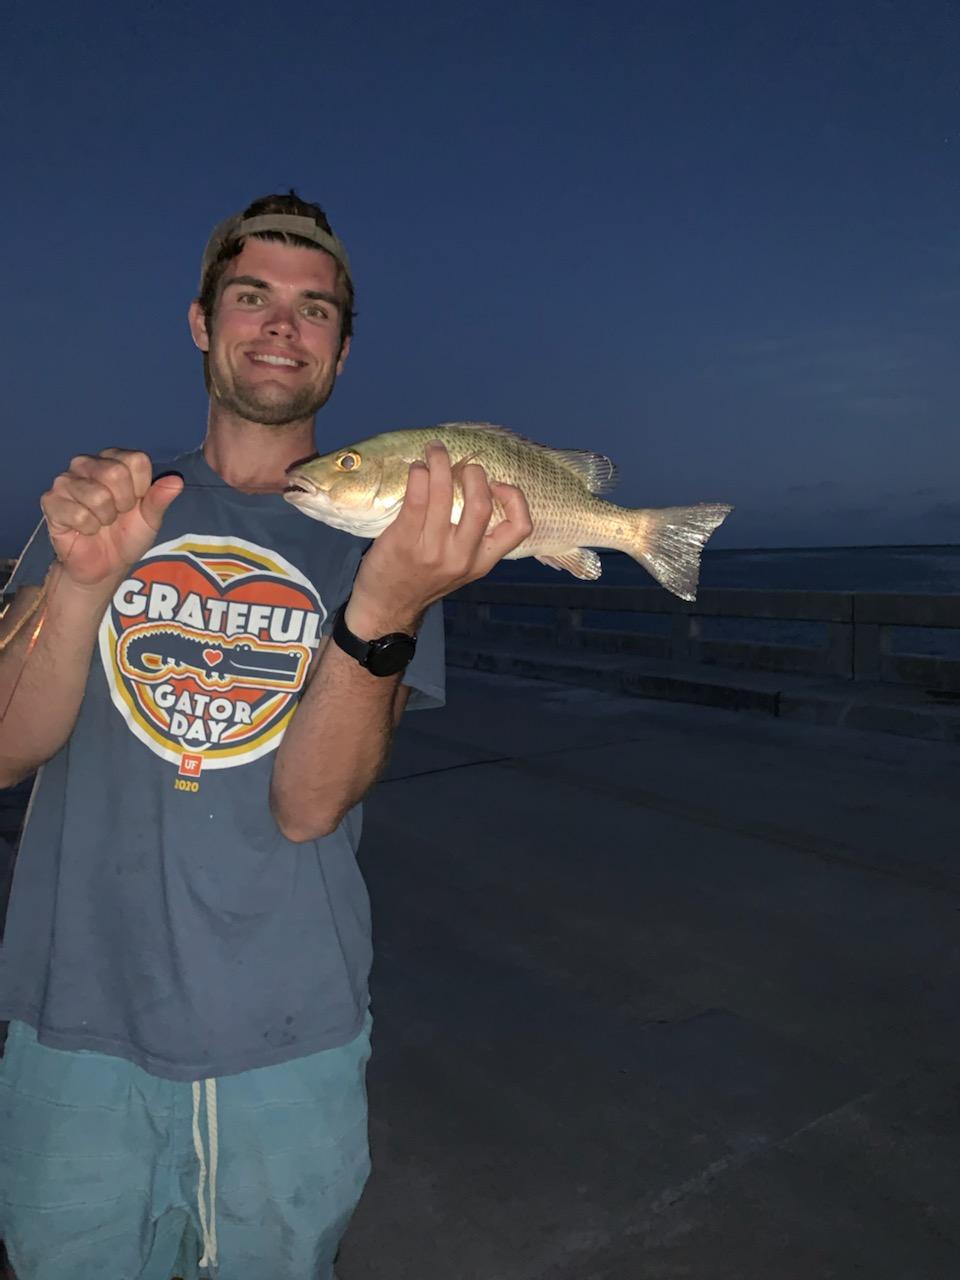
This is exactly how scientists, engineers, and fisheries biologists study aquatic behavior. You are doing the same thing, except your reward is more fish on the line…and awesome fish pictures.
Final Thoughts
Fishing is supposed to be fun, relaxing, and unpredictable. But if you want more consistent success it pays to treat your trips like mini experiments. Just a few minutes of logging your conditions in Excel can lead to massive improvements over time. You can do this by writing down the information in a journal, then transferring it to the computer. You can also get Excel on your phone and record it this way. My personal favorite way of recording prior to transferring into excel is just to take pictures and record the data that way. You can show the lure, the fish, the tide, and even wind direction and water clarity.
You do not need fancy software. You do not need expensive gear. You only need a simple spreadsheet and the willingness to record your data. The more you track the more patterns you will see and the more fish you will catch.
If you want your own custom tracker, I can create a full Excel file for you formatted exactly the way you like it, including data validation, drop downs, automatic graphs, and built in catch rate calculations. Reach out to me at benswaringen@yahoo.com


Leave a Reply